Refining Sole Geometry: Pressure Mapping Data Drives Traction Optimization in Multi-Terrain Footwear
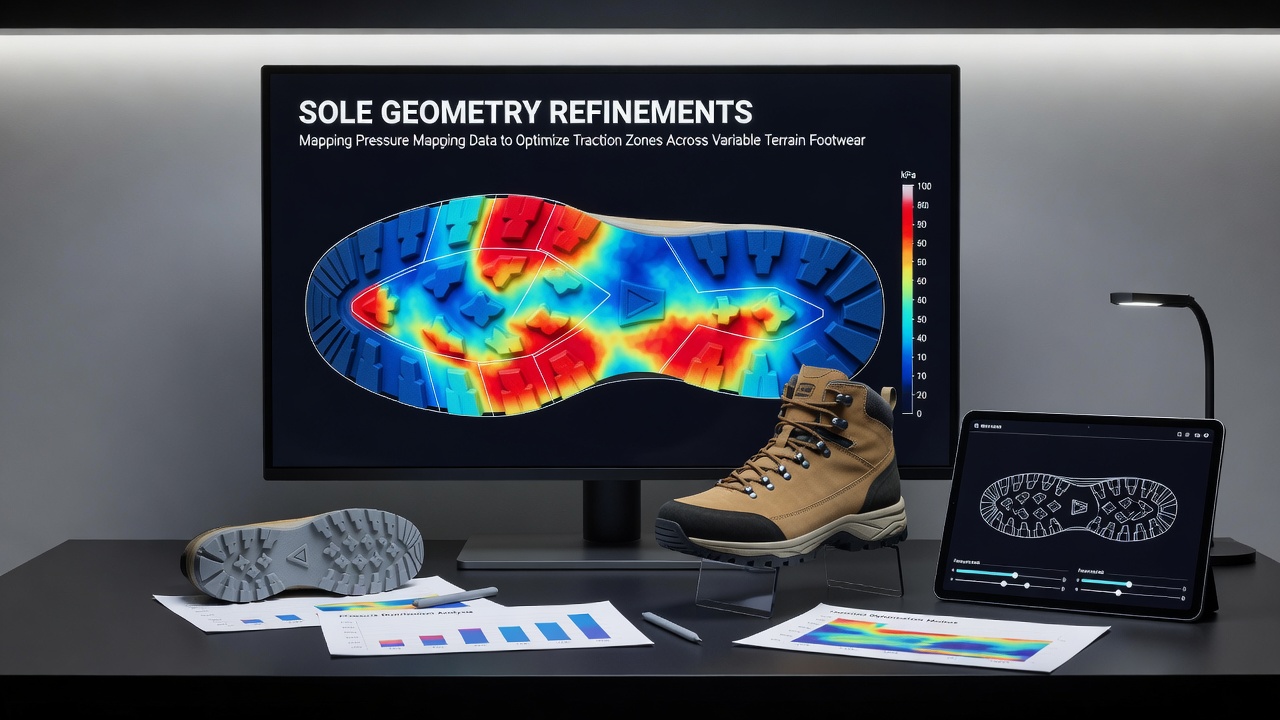
Footwear engineers apply pressure mapping systems to collect detailed readings of how feet distribute force during movement, and these readings guide adjustments to sole geometry that improve traction across surfaces ranging from packed trails to loose gravel and wet pavement. Sensors placed inside test shoes record peak pressures, contact times, and shear forces while athletes or test subjects walk, run, or change direction on varied terrain, creating datasets that reveal which zones require more aggressive lug patterns and which areas benefit from smoother transitions.
Manufacturers translate the collected data into three-dimensional sole models that position rubber compounds and tread depths according to measured load paths. High-pressure zones under the forefoot and heel receive deeper, multi-directional lugs designed to bite into soft ground, while midfoot sections often feature flatter, wider elements that maintain stability on hard surfaces. This mapping approach replaces earlier trial-and-error methods with quantifiable targets that shorten development cycles and reduce the number of physical prototypes needed.
Data Collection Methods and Sensor Placement
Pressure mapping platforms combine in-shoe sensor arrays with force plates embedded in laboratory floors or portable walkways, and researchers calibrate each system to capture both normal and tangential forces at frequencies exceeding 200 hertz. Test protocols typically include repeated trials on surfaces such as concrete, grass, sand, and inclined wooden boards that simulate uphill and downhill conditions. Technicians mark anatomical landmarks on each participant’s foot to align sensor data with specific sole regions, ensuring that refinements correspond to actual contact points rather than averaged approximations.
Software processes the raw measurements into color-coded pressure maps that highlight gradients between adjacent zones. Engineers then adjust CAD models by increasing or decreasing lug height, altering angles of attack, and redistributing flex grooves so that deformation under load matches the observed pressure distribution. Iterative testing cycles refine these changes until measured traction metrics stabilize across repeated trials.
Application to Variable Terrain Designs
Trail running shoes represent one category where pressure mapping has produced measurable shifts in sole architecture. Data from runners navigating root-covered paths and muddy switchbacks show concentrated lateral forces near the medial forefoot during cutting maneuvers, prompting designers to add reinforced chevron lugs in those areas while reducing material elsewhere to control weight. Road-to-trail hybrid models use similar datasets to create transition zones that maintain grip when pavement gives way to gravel without requiring athletes to change footwear mid-activity.

Cycling shoes adapted for mixed-surface events apply the same principles to cleat mounting regions and sole stiffness profiles. Pressure recordings taken during standing starts on grass and seated climbing on asphalt reveal distinct loading patterns that influence how much torsional flex is built into the forefoot. These refinements help maintain efficient power transfer while preventing excessive slip when riders encounter wet or uneven sections.
Industry and Research Developments Through Mid-2026
Industry reports compiled through July 2026 document increased adoption of wireless pressure mapping systems that transmit data in real time during field tests, allowing teams to adjust prototypes between training sessions rather than waiting for laboratory analysis. Academic groups have published comparative studies that correlate refined sole geometries with reductions in measured slip distances on standardized wet surfaces. One project coordinated across institutions in Canada and Australia examined how pressure-informed lug spacing affects braking distances on clay trails, and the resulting open datasets now inform design guidelines circulated among component suppliers.
Trade organizations such as the Australian Sports Commission have incorporated pressure mapping metrics into equipment evaluation frameworks used by national teams preparing for multi-terrain competitions. Parallel work at European research centers focuses on standardizing sensor calibration procedures so that data collected on different continents can be compared directly.
Integration With Material Selection
Once geometry targets are established, material engineers select rubber hardness and siping patterns that complement the pressure-derived shapes. Softer compounds occupy zones where mapping shows prolonged ground contact, increasing friction without excessive wear, while harder inserts reinforce high-impact areas identified in the datasets. Finite element simulations run on the updated sole models predict how each compound will deform under the recorded force vectors, reducing the likelihood of unexpected traction loss once production begins.
Conclusion
Pressure mapping continues to supply objective measurements that guide sole geometry refinements across categories of variable-terrain footwear. The resulting designs position traction elements according to documented load distributions rather than uniform patterns, and ongoing data collection supports further adjustments as athletes encounter new surface combinations. Continued collaboration between laboratories, manufacturers, and standards bodies maintains the link between recorded pressure profiles and functional performance on diverse terrain.